Yes, we are capable of directly measuring the motion of tectonic plates…
… and the rate at which energy builds up on faults for future earthquakes!
During the 1990s, the development of satellite positioning technology (GPS, for “Global Positioning System”) allowed everyone to instantly locate themselves to within a few meters. GPS quickly became widespread as applications of realtime positioning flourished. Today, all mobile phones have a GPS that provides a position and a path on a map, whether one is on foot, on a boat or in the air. This same technology can also be used to determine a position with an accuracy of just a few millimeters. This, however, requires GPS equipment that is more sophisticated (and more expensive!) than the one carried in a cell phone! It also requires the ability to correct data for errors related to the quality of GPS satellite orbits, the refraction of the GPS signal in the atmosphere, etc. All this requires fancy computer calculations that are made after the fact: it can take up to 2 weeks to obtain the most precise and accurate position of a given location. But one can get it within a few mm! Tiny changes of position due to plate tectonics or other processes (volcanic activity, landslides, etc.) can then be tracked over time.
Geophysicists use this technique by installing GPS antennas and receivers on top of well-defined markers in the ground. They then use the satellite data recorded by these instrument to calculate a precise position, typically averaging the entire data collected each day. These daily positions have a precision of around 2-3 mm. The figure below shows the position of a GPS station located on the island of St. Croix in the Virgin Islands. This particular station receives satellite data continuously so that one can compute one position per day over many years of data. One can see that the position of the station changes linearly over time: this movement is that of the Caribbean tectonic plate, which “carries” this station. The slope of each graph directly provides the speed of the plate at that particular location.
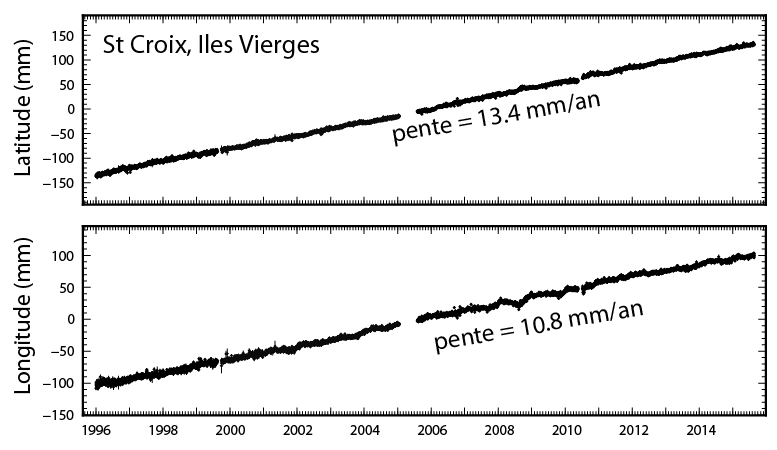
The position of a GPS station on St Croix Island in the northeastern Caribbean is calculated every day with an accuracy of a few millimeters. The very continuous and linear evolution of this position as a function of time gives the speed of this site, which materializes the current motion of the Caribbean tectonic plate.
One can then represent the motion of a specific site in the form of a vector (an arrow) whose east-west and north-south components are the speed in the east-west and north-south directions as determined above . If we do this exercise in Haiti, we observe (1) a speed of the order of 15 mm/year between the north and south coasts of the country, which indicates that the island, stuck between the Caribbean and North American tectonic plates, is subject to east-west shear, and (2) two zones across which the observed speeds change rapidly: the Cul-de-Sac plain and the north coast of Haiti. The velocity “jumps” corresponding to the Enriquillo and Septentrional faults are locations where elastic energy, to be released in future earthquakes, is currently building up.
Top: Horizontal velocities measured by GPS in Hispaniola, expressed relative to the Caribbean plate assumed fixed. Bottom: North-south section through Hispaniola showing the topography (gray line) and the velocities measured by GPS (blue dots with their error bars) in the east-west direction. Two “jumps” in the measured velocities can be observed, which correspond to the Southern Peninsula (= Enriquillo) and Septentrional faults.
The seismic potential of these two major faults can even be quantified a bit more. Historical records indicate that the Southern Peninsula (or Enriquillo) fault has not experienced a major earthquake since 1701-1751, or about 250 years. Therefore, the fault itself has not slipped during this time interval. Indeed, all geological and geophysical observations all indicate that this fault was “stuck”, or “locked” for 250 years. However, GPS measurements show that the two blocks on either side of the fault were moving at a speed of 7 mm/year. Therefore, the fault has been accumulating, over time, a deficit of motion compared to the two blocks surrounding it. Over 250 years, this deficit amounts to 250 years x 7 mm/yr = 1.5 meters. The most common way for faults to catch up is to slip suddenly during an earthquake. Seismology shows that the larger the fault slip during an earthquake, the larger its magnitude. For instance, an earthquake slip of 1.5 meters corresponds to a magnitude of 7.1. One can therefore infer that the Southern Peninsula (or Enriquillo) fault has the potential to generate an earthquake on the order of 7.1 if its entire slip deficit is released at once. This is close to the magnitude of the 2010 and 2021 earthquakes in southern Haiti. Since a magnitude 7 earthquake cannot exceed slippage over a fault length of about 30 km, it will take several similar earthquakes to release the accumulated deficit along the entire 200 km length of the Southern Peninsula fault in Haiti. In other words, the 2010 or 2021 earthquakes in southern Haiti were not “the Big One”, which is still to come.
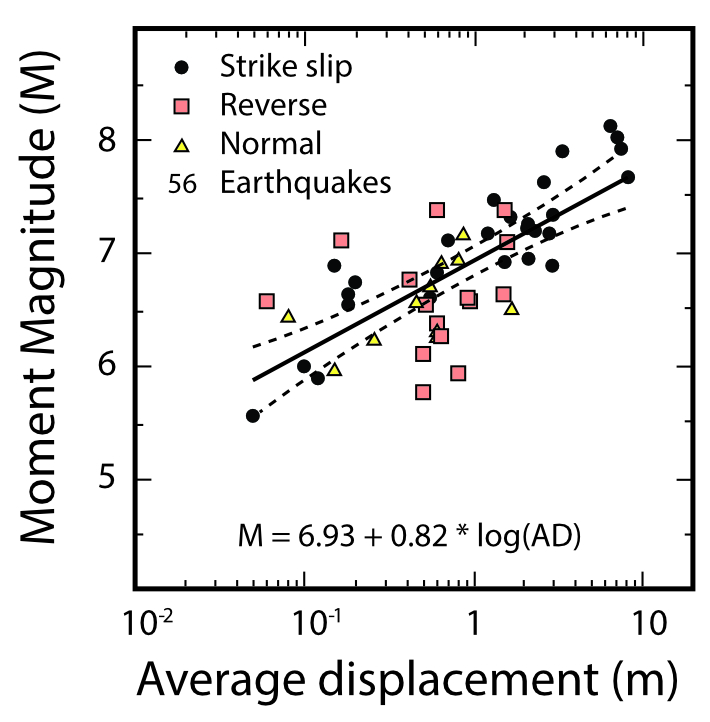
Magnitude as a function of average earthquake fault displacement. The symbols represent actual earthquakes, the solid black line shows a fit through the data. One can see that an earthquake slip of 1.5 meters corresponds to a magnitude of about 7.1.